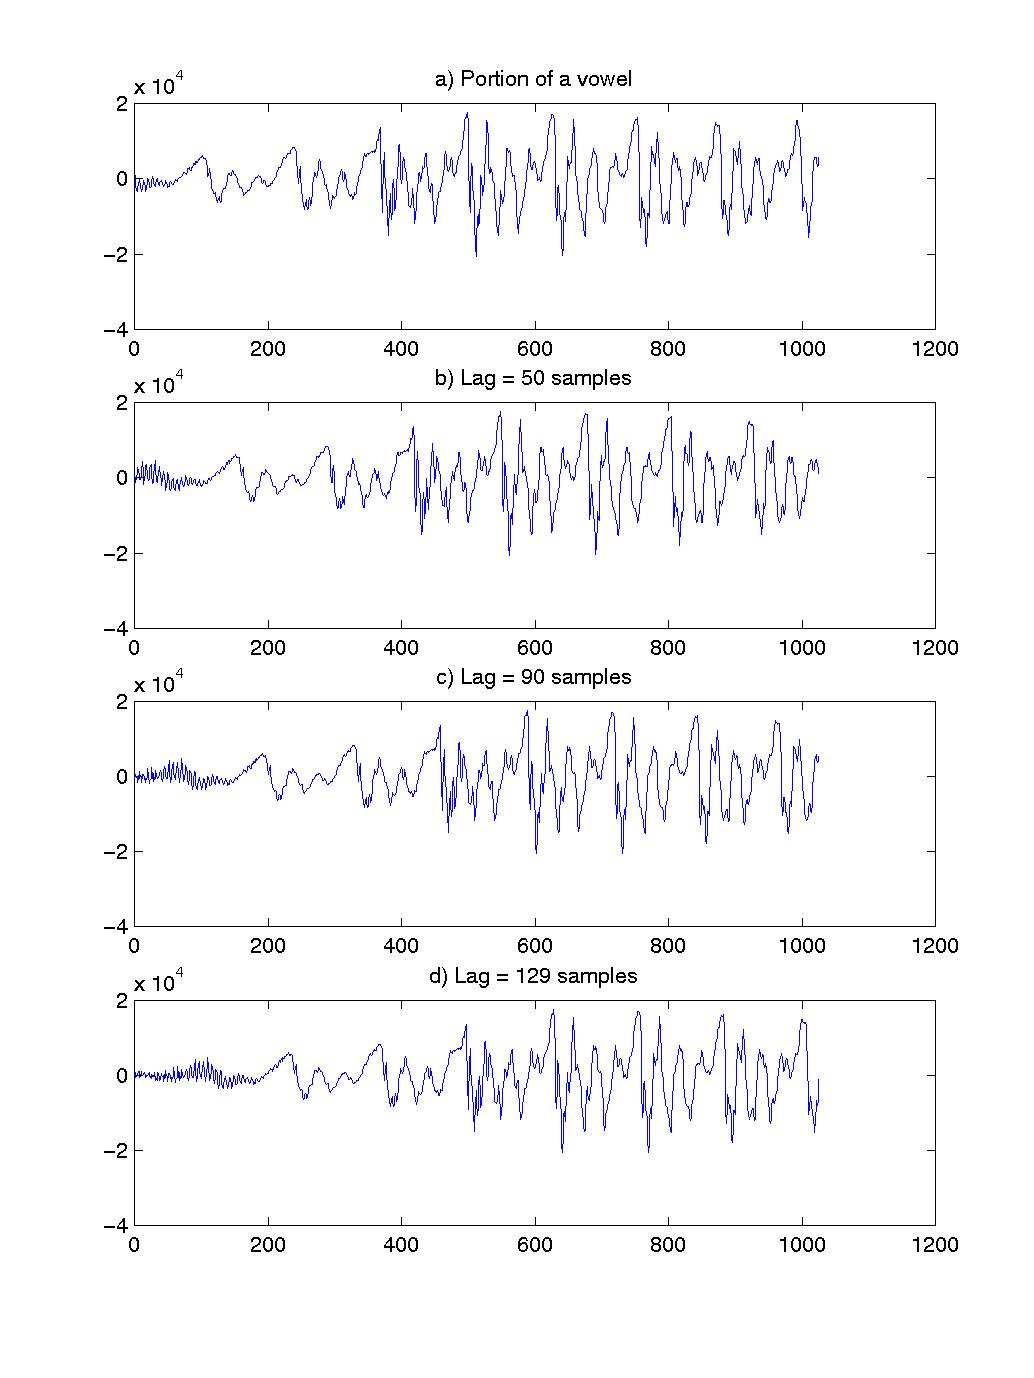
Figure 5.4. Illustration of the degrees of similarity between a portion of a signal (a) and time-shifted copies of that portion (b–d).