You are here: Home /
People
/
Prof Coleman
/
Course materials tt09
/
Lecture 4
/
Auto correlation method
/
Fig 5.4
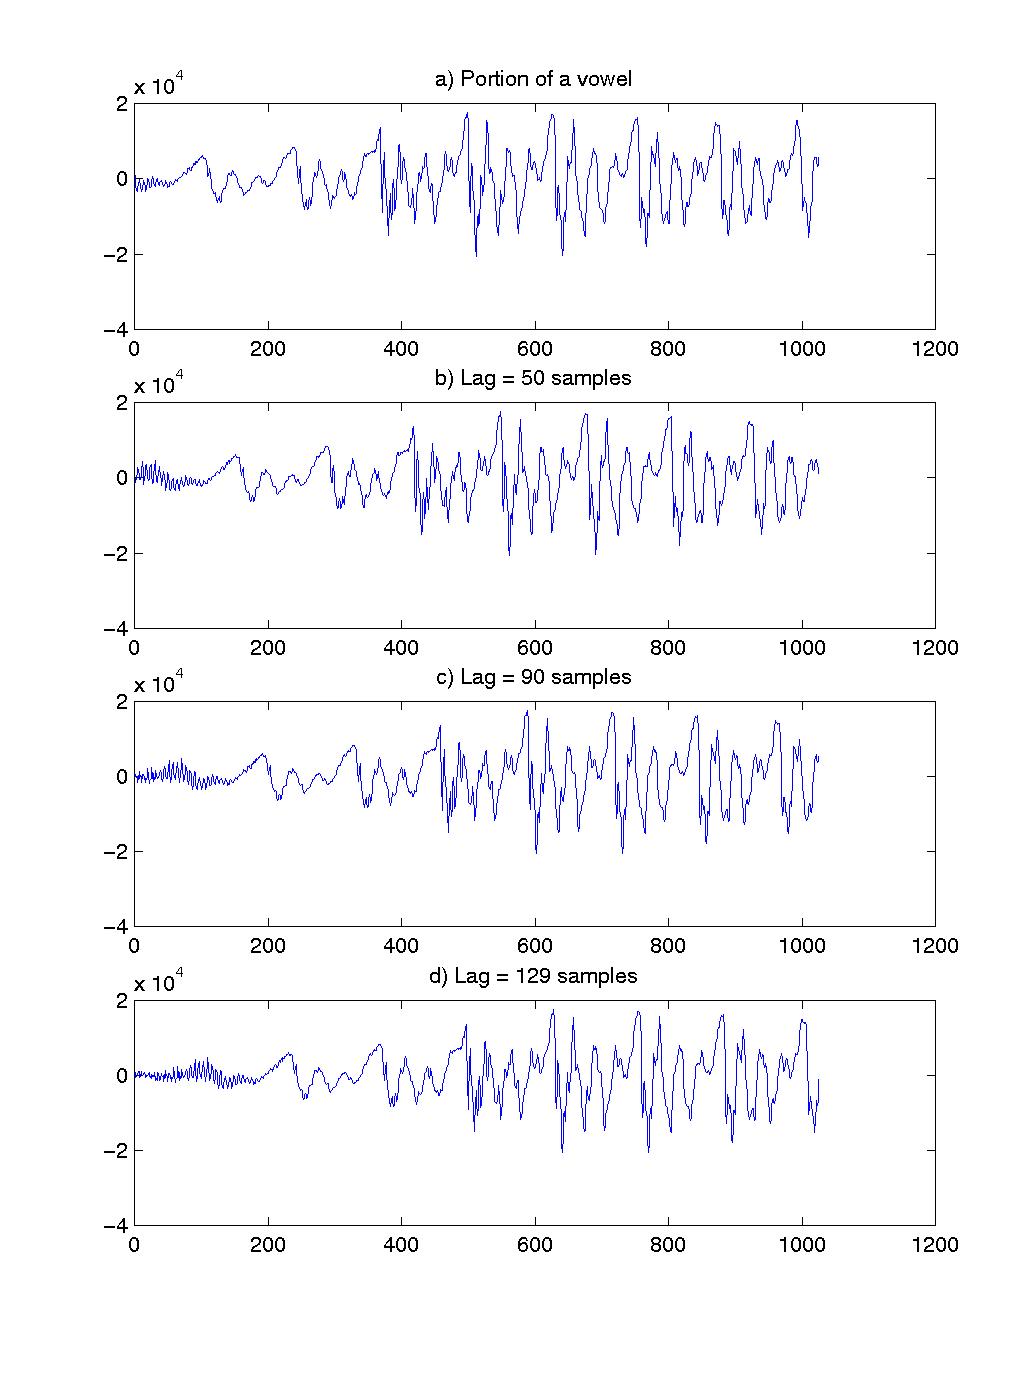
Figure 5.4. Illustration of the degrees of similarity between a portion of a signal (a) and time-shifted copies of that portion (b–d).
Phonetics Laboratory, 41 Wellington Square, Oxford OX1 2JF
Email: enquiries@phon.ox.ac.uk | Tel: +44 1865 270444 | Fax: +44 1865 270445
Disclaimer
Email: enquiries@phon.ox.ac.uk | Tel: +44 1865 270444 | Fax: +44 1865 270445
Disclaimer